

Why Competitive Analysis is Key to Winning on Amazon
In Amazon’s digital marketplace, competitive analysis is crucial, particularly, for business owners introducing new products.
At its core, this analysis is about understanding your place in the market; it’s about gaining insights into market share, determining brand positioning, and evaluating customer acquisition costs.
To fully grasp the impact of competitive analysis, let’s break down these components:
- Understanding market share: Competitive analysis helps in assessing market share. Knowing how much of the market your competitors command gives you a realistic picture of the potential customer base. For a new product like wireless earphones, it’s essential to understand whether the market is saturated or if a gap is waiting for your product to fill.
- Assessing Brand Positioning: This analysis allows you to see how competitors position themselves. Are they premium, budget-friendly, or somewhere in between? Understanding this helps you position your product to fill a market need and differentiate it from existing offerings.
- Understanding the customer acquisition cost: Competitive analysis sheds light on the investment required to attract and retain customers. In the competitive world of Amazon, where customer loyalty can be fleeting, knowing how much your competitors spend on acquiring customers can guide your marketing strategies.
Essentially, competitive analysis on Amazon goes beyond observing competitors. It’s a strategic approach that informs vital business decisions, helping you navigate the competitive market with data-driven insights.
By leveraging these insights, you can make informed decisions about pricing and positioning, thus setting the stage for a successful product launch and long-term market presence.
Extracting Data for Competitive Analysis on Amazon using ScraperAPI
Now, let’s put theory into practice; we will use the scenario of our company preparing to launch wireless earphones on Amazon. The challenge? Navigating through the sea of competitors and carving out a unique space in the market.
Here, ScraperAPI comes into play as our navigational tool. We’ll use ScraperAPI and Python’s requests library to gather critical product data from Amazon—a process vital for an in-depth understanding of the competition.
From price points to customer ratings, we’ll extract the essentials and then, using pandas, transform this raw data into a structured, analysis-ready format, which we will store in a CSV.
Lastly, using Excel, we’ll extract meaningful insights from the data to complete our analysis.
Ready? Let’s get started!
Requirements
Before jumping into our analysis, setting up your environment with the necessary tools and libraries is crucial.
Here’s a step-by-step guide to getting you started:
- Python and Library Setup: First, ensure you have Python installed on your system, ideally version 3.8 or newer, as it’s compatible with most libraries used in data analysis.
- Get Your API Key: Create a free ScraperAPI account to get access to your API key, the Amazon Structured Endpoint, and 5,000 API credits to test the tool.
- Installing Required Libraries: Next, open your terminal or command prompt. To install the libraries necessary for working with ScraperAPI and handling data, execute the following commands:
pip install requests pandas
- Setting Up Your Project: Now, let’s create a dedicated directory and a Python script where your code will reside. In your terminal or command prompt, run these commands:
mkdir amazon_analysis
touch amazon_analysis/app.py
Now that you have set up your environment let’s dive into coding and analyzing data to uncover Amazon market insights!
Understanding Amazon Search Page Layout
The first step in scoping out our competitors is to do a simple search on Amazon for our product, “wireless earphones”, and filter the featured products that are the most recommended; this is where we want to end up when launching our new product.
This is a snapshot of what you’d see when searching for “wireless earphones” on Amazon sorted by featured:
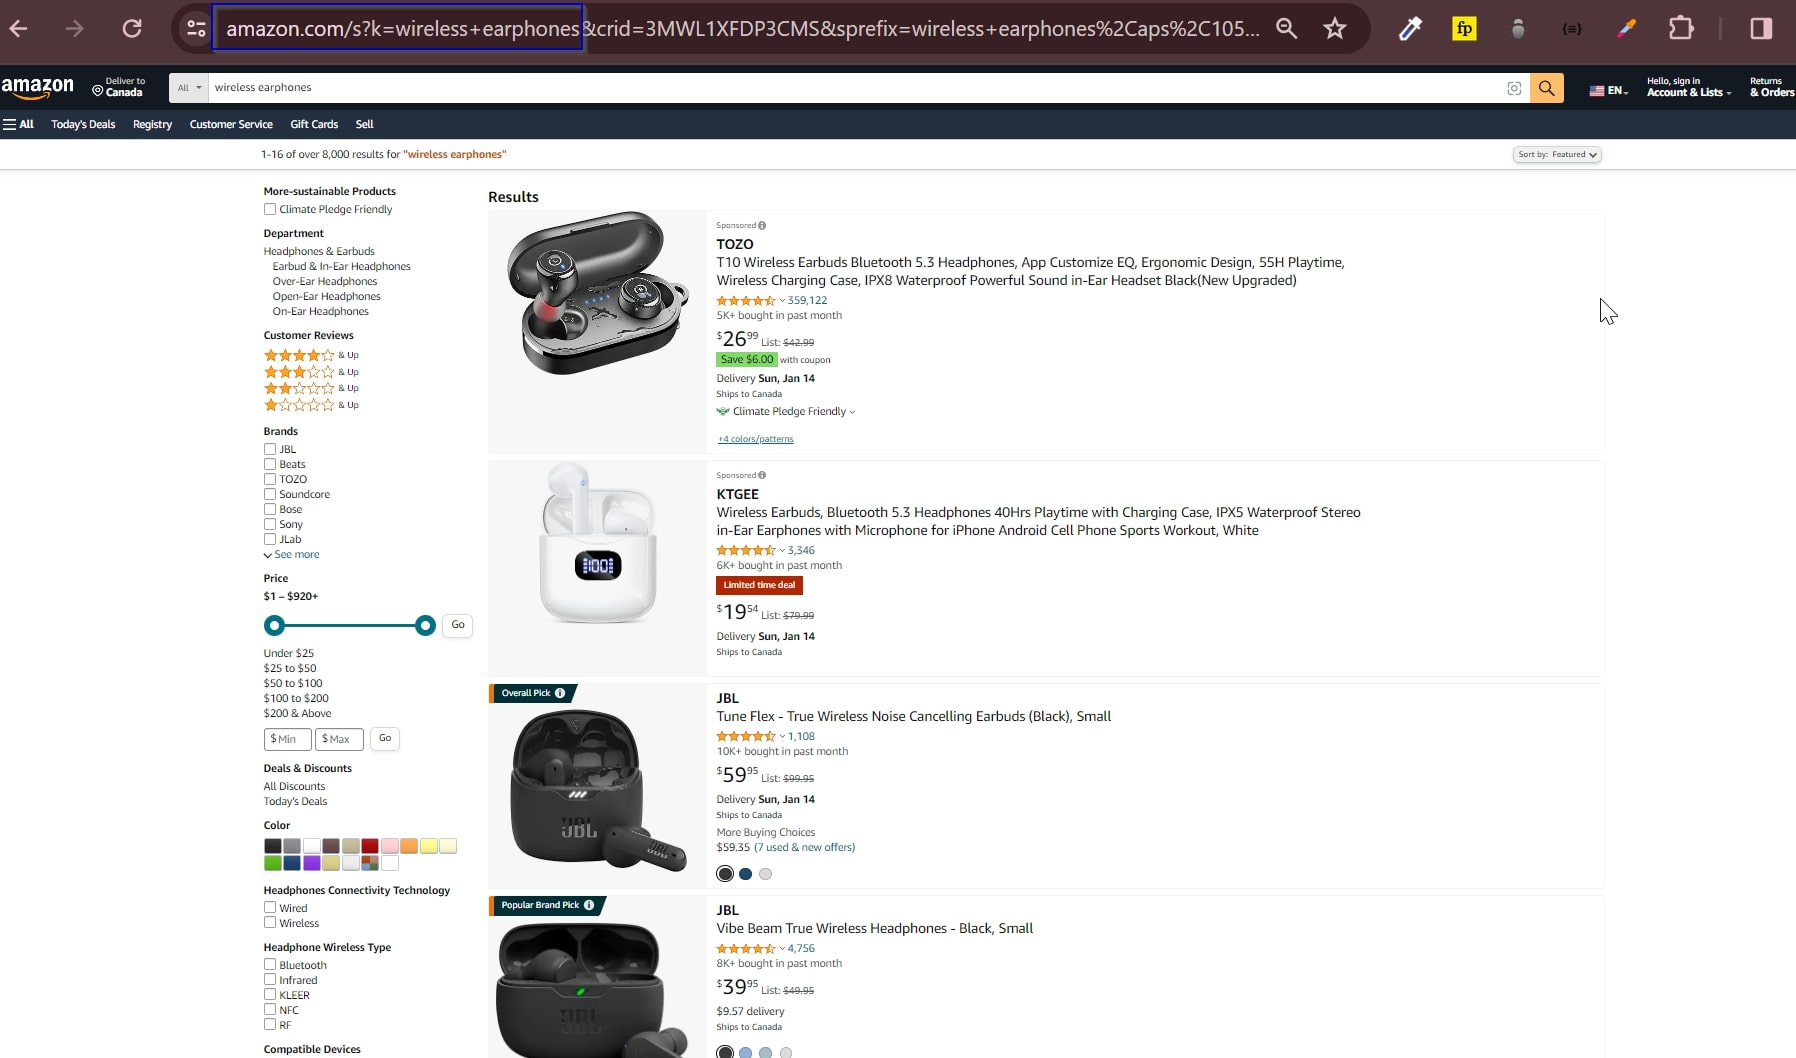
From this page, we’ll extract each product’s ASINs (Amazon Standard Identification Numbers), which will allow us to use ScraperAPI’s Amazon Product endpoint to access structured information like prices, ratings, and reviews.
Important Update
To simplify the process, you can now use our Amazon Search endpoint to collect all product ASINs from any Amazon search result page.
Just send your
get()request to the endpoint alongside your API key and query, and let us do the rest. The endpoint will return all products listed in JSON format, allowing you to extract specific data points using key-value pairs.To get the name and ASIN from the products, target the keys
nameandasin. To test this, let’s use the same query (wireless earphones) as the rest of the tutorial:import requests import json asins = [] payload = { 'api_key': 'YOUR_API_KEY', 'query': 'wireless earphones', 'country': 'us', } response = requests.get('https://api.scraperapi.com/structured/amazon/search', params=payload) earphones = response.json() all_products = earphones['results'] for product in all_products: if product['asin'] != None: asins.append(product['asin']) else: print('not found') with open('asins.json', 'w') as f: json.dump(asins, f)Here’s what you’ll get:
[
   "B0C1ZF8TVF",
   "B097F4V3FJ",
   "B0CJCHDKLF",
   "B0BYSQDWRT",
   "B0CTS23YQ8",
   "B07RGZ5NKS",
   "B0BTYCRJSS",
   "B09T5Z8L9G",
   "B096SV8SJG",
   "B0BQPNMXQV",
   "B09CY995KT",
   "B0CPJG173J",
   "B0CJDSNWRQ",
   "B0CJJHSFFP",
   "B0CSPGM8PX",
   "B0BTLVHMHW",
   "B09FT58QQP",
   "B095BV8R27"
]
Check the Amazon Search Endpoint documentation to learn more.
First, to find the ASINs on the page, let’s inspect the page. We can see that every product card is wrapped by the following div:
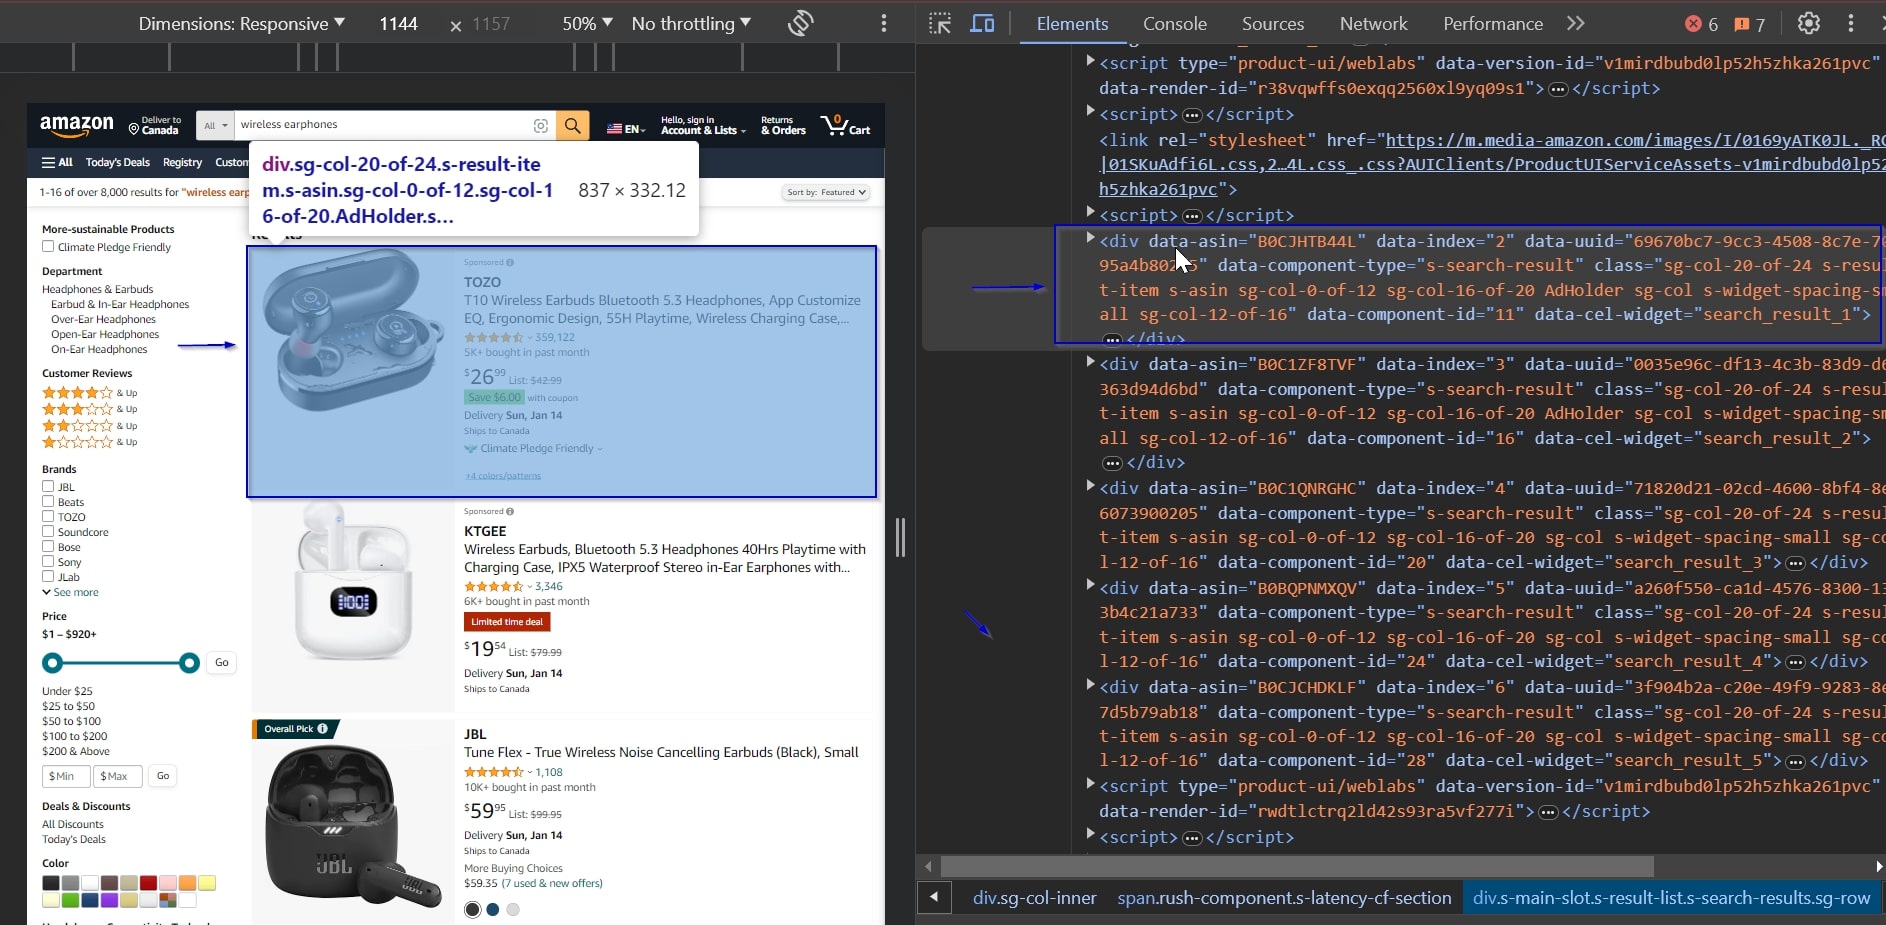
The product’s ASIN code is stored inside a data-asin attribute within each div element. We will use this to extract the ASIN codes of each product.
Now that we’ve figured out the HTML elements we need to target, let’s start with the actual coding part and extract some data!
Step 1: Importing Libraries
First up, import all the necessary libraries. This includes:
requestsfor web scraping using Scraper API.csvto manage data files.BeautifulSoupfor HTML parsing.sleepto pace our requests.pandasfor data cleaning.
These Python libraries are essential for exploring and extracting the data we need from Amazon.
import requests
import csv
from bs4 import BeautifulSoup
from time import sleep
import pandas as pd
Step 2: Initializing Constants
We’ll first input our ScraperAPI key as API_KEY, and define BASE_URL with the Amazon search URL we got from our initial search for wireless earphones, and then, we create an empty list called ASINS for storing the ASINs we’ll gather.
Note: Don’t have an API key? Create a free ScraperAPI account to get 5,000 API credits to try all our tools for 7 days.
We’re using a base URL because we will be going through the first 5 pages to collect the product ASINs and will be adding onto the URL to do that.
API_KEY = 'YOUR_API_KEY'
BASE_URL = 'https://www.amazon.com/s?k=wireless+earphones'
ASINS = []
Step 3: Scraping Amazon Product ASINs
Our next step is to navigate through Amazon’s search results and extract the product ASINs from them. We aim to identify and extract ASINs from the most visible products our future customers will likely encounter first.
We start a loop to go through the first five pages of the Amazon search results for ‘wireless earphones.’
For each iteration, we construct the URL for the current page by appending '&page=' and the page number to the base URL.
for page in range(1, 6):
    url = f'{BASE_URL}&page={page}'
We prepare a payload dictating our request. It includes our API key (to authenticate with ScraperAPI) and the constructed URL.
payload = {
        'api_key': API_KEY,
        'url': url
    }
Next, we send a get() request to ScraperAPI with the payload. If the response is successful (status code 200), we parse the page content.
We’re using BeautifulSoup to parse the HTML content of the response, allowing us to navigate and extract data from it.
try:
        response = requests.get('https://api.scraperapi.com', params=payload)
        if response.status_code == 200:
            soup = BeautifulSoup(response.content, 'html.parser')
We’ll use BeautifulSoup’s select method to find all div elements with a 'data-asin' attribute containing the products’ ASINs.
We extract the ASIN and add each product ASIN found to the ASINS list, provided it’s not an empty string.
products = soup.select('div[data-asin]')
            for product in products:
                asin = product.attrs['data-asin']
                if asin != '':
                    ASINS.append(asin)
We also handle any potential errors. If the response status code is not 200, we log an error. We also catch any exceptions that might occur during the request.
After processing each page, we pause for one second using sleep(1). This is a good practice to avoid sending requests too quickly and to mimic human-like access patterns.
else:
            print(f"Error on page {page}: Received status code {response.status_code}")
    except requests.RequestException as e:
        print(f"Request failed on page {page}: {e}")
    sleep(1)
Step 4: Extracting Amazon Product Data
Now that we have our lists of ASINs, we can get into using the Structured Data Endpoint to get the detailed product data we need for our analysis.
Note: Read more about our Structured Data Endpoint and Scraping Amazon with it.
We start by creating a new CSV file named products_info.csv to store the product data we will extract.
Using the csv.writer function, we set up a writer object to write to this file.
The first row, written into the file, contains the headers: ‘Name’, ‘Brand,’ ‘Price,’ ‘Total Reviews,’ and ‘Ratings.’ These represent the data we will collect for each product.
with open('products_info.csv', 'w', newline='', encoding='utf-8') as file:
    csv_writer = csv.writer(file)
    csv_writer.writerow(['Name', 'Brand', 'Price', 'Total Reviews', 'Ratings'])
We iterate through each ASIN in our ASINs list. We then prepare a payload for each ASIN with our API key, the ASIN, and the country code (in this case, ‘us’).
This payload will be used to fetch detailed product data.
for asin in ASINS:
        product_payload = {
            'api_key': API_KEY,
            'asin': asin,
            'country': 'us'
        }
For each ASIN in our list, we make a request to ScraperAPI’s product endpoint:
https://api.scraperapi.com/structured/amazon/product
After receiving a successful response, we parse the JSON data containing the detailed product information.
 try:
            product_response = requests.get('https://api.scraperapi.com/structured/amazon/product', params=product_payload)
            if product_response.status_code == 200:
                product_data = product_response.json()
This is how the product data would look in JSON format:
{
        "name": "Wireless Earbuds Bluetooth Headphones 80hrs Playback Ear Buds IPX7 Waterproof & Power Display with ENC Noise Canceling Mic Over-Ear Stereo Bass Earphones with Earhooks for Sports/Workout/Running",
        "product_information": {
            "package_dimensions": "4.29 x 3.5 x 1.54 inches",
            "item_weight": "5 ounces",
            "asin": "B0CPWGWZWP",
            "item_model_number": "BX17",
            "customer_reviews": {
                "ratings_count": 109,
                "stars": 5
            },
            "best_sellers_rank": [
                "#40,680 in Electronics (See Top 100 in Electronics)",
                "#2,540 in Earbud & In-Ear Headphones"
            ],
            "date_first_available": "December 10, 2023",
            "manufacturer": "Catitru",
            "number_of_items": "1"
        },
        "brand": "Brand: Catitru",
        "brand_url": "https://www.amazon.com/Catitru/b/ref=bl_dp_s_web_115788612011?ie=UTF8&node=115788612011&field-lbr_brands_browse-bin=Catitru",
        "full_description": "Product Description Catitru Wireless Earbuds Sport High Quality Stereo Sound ENC Noise Cancelling 80hrs Playtime IPX7 Waterproof & Sweat Resistant Unique Button Design Designed for Sports",
        "pricing": "$89.99",
        "shipping_price": "FREE",
        "availability_status": "In Stock",
        "images": [
            "https://m.media-amazon.com/images/I/41ITCINhi6L.jpg",
            "https://m.media-amazon.com/images/I/51Fdl0Ko4CL.jpg",
            "https://m.media-amazon.com/images/I/51Cd28kpBAL.jpg",
            "https://m.media-amazon.com/images/I/51BUgPqvL5L.jpg",
            "https://m.media-amazon.com/images/I/51yeY3NUeOL.jpg",
            "https://m.media-amazon.com/images/I/51MwrWN5EML.jpg",
            "https://m.media-amazon.com/images/I/51asM0-26dL.jpg"
        ],
        "product_category": "Electronics > Headphones, Earbuds & Accessories > Headphones & Earbuds > Earbud Headphones",
        "average_rating": 5,
        "feature_bullets": [
            "【Sports Comfort & IPX7 Waterproof】- BX17 wireless headphones Designed with elastic and soft ear hooks, these Bluetooth sports earbuds stay securely in place and provide ultimate comfort even during extended workout sessions. The earphones come with three different sizes of ear tips, ensuring a perfect fit for various ear sizes. With an IPX7 waterproof rating, they effectively resist water splashes and sweat, making them ideal for sports, fitness, workouts, and running.",
            "【Fast Pairing & Wide Compatibility】- BX17 wireless earbuds Built in hall switch, headphones wireless bluetooth will auto power on and connect with your last device once you open the charging case after first connection, which is faster and more convenient.",
            "【ENC Noise Cancelling Earbuds and Immersive Stereo】- BX17 ear buds have strong 12mm speakers driving units and in ear acoustic structure support, which produces a strong bass and bright treble. The unique acoustic design of the cavity room, balanced internal and external air pressure, avoid sound loss, ensure stable sound and penetrating power, even in a noisy environment can provide clear voice detection. You can enjoy your personal space whether you are indoors, work or exercise.",
            "【Upgraded 80H Playtime & LED Power Display】- BX17 upgraded Bluetooth earbuds with a longer battery charging case, it has 15 hrs more playtime than BX17 1st generation. Up to 80 hrs of total listening time in turn, one earbud can be used for 15 hours on one charge. The case can provide extra 8 times the full charge for earbuds. The ear buds wireless bluetooth earbuds with a dual digital power display case, easy to know the remaining power in real-time while opening or closing the case.",
            "【Type-C Fast Charging and Intuitive Button Touch Controls】- Our wireless charging case can be used with a fast Type-C cable. The button control feature provides a hassle-free user experience, with just one touch, you can always be in control of your audio experience, easily controlling music playback, adjusting volume and managing calls. All at your fingertips."
        ],
        "total_reviews": 109,
        "model": "BX17",
        "ships_from": "Amazon",
        "sold_by": "Yishenghuimaoyiyouxiangongsi",
        "aplus_present": true
    }
We will only extract key details from this JSON data – name, brand, pricing, total number of reviews, and average rating, which we will write into our CSV file, storing the data for each product.
We are using the CSV format because it will be easier to manipulate when we do our analysis in Excel.
csv_writer.writerow([
                product_data.get('name'),
                product_data.get('brand'),
                product_data.get('pricing'),
                product_data.get('total_reviews'),
                product_data.get('average_rating')
            ])
We also include error handling for any unsuccessful requests or exceptions, ensuring we know of any issues during the data extraction process.
else:
                print(f"Error for ASIN {asin}: Received status code {product_response.status_code}")
        except requests.RequestException as e:
            print(f"Failed to fetch data for ASIN {asin}: {e}")
Step 5: Cleaning Amazon Data for Analysis
This is how our CSV file product_info.csv looks currently:
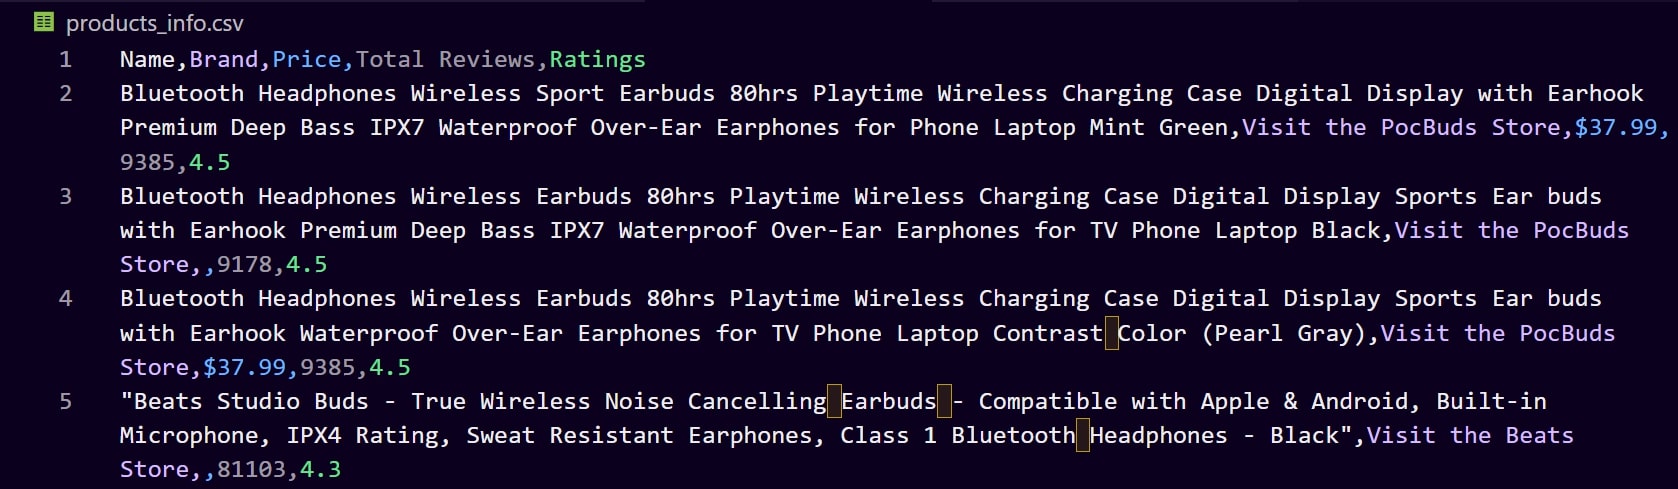
Looking at the file, there are a couple of data integrity issues:
- The product names are pretty long and contain excess information that might not be necessary for our analysis.
- The brand names include additional text like “Visit the PocBuds Store,” which is not needed for our analysis.
- The prices include a dollar sign (‘$’), which makes them strings in the dataset. For any numerical analysis, we need to convert these to a numerical format.
To address these data integrity issues and prepare our dataset for analysis, we will:
- Drop the ‘Name’ Column: In this article, we will focus on price and rating analysis, and the product names are overly detailed, so we’ll remove this column and use the ‘Brand’ column for reference.
- Clean the ‘Brand’ Column: We’ll strip additional text such as “Visit the [Brand] Store” to have clear and concise brand names.
- Format the ‘Price’ Column: We’ll also convert the price values from strings to numerical format by removing the dollar sign (‘$’) and converting the text to a floating-point number.
- Check for Missing Values: We ensure no missing values are in the ‘Total Reviews’ and ‘Ratings’ columns. If any are found, we’ll drop the rows that contain them.
- Standardize Data Formats: We’ll ensure that all data, especially in the ‘Ratings’ and ‘Total Reviews’ columns, follows a consistent format for accurate comparative analysis.
We will use the pandas library to clean our data to achieve this.
Preparing Our DataFrame
We’ll load our CSV file into a pandas DataFrame, an incredibly versatile tool for data manipulation.
df = pd.read_csv('products_info.csv')
Removing the “Name” Column
To remove the “Name” column, we use the drop() function. The drop function in pandas efficiently eliminates specified columns or rows.
By setting axis=1, we specify column-wise operation, and inplace=True ensures the change is applied directly to our DataFrame.
df.drop('Name', axis=1, inplace=True)
Using the replace() Function
To ensure our Brand column is consistent, we use the replace() function. This function searches for specified text patterns and replaces them with the desired text (in this case, an empty string to remove the unwanted text).
After this, strip() removes any leading and trailing spaces, ensuring our brand names are neat and uniform.
df['Brand'] = df['Brand'].str.replace('Visit the ', '', regex=False).str.strip()
df['Brand'] = df['Brand'].str.replace('Brand: ', '', regex=False).str.strip()
Converting Data Into Numbers
To convert the ‘Price’ column to floats for numerical analysis, we first use replace(); this removes the dollar signs and commas.
Then, astype(float) converts the cleaned strings into floating-point numbers, preparing them for any mathematical operations needed in our analysis.
df['Price'] = df['Price'].str.replace(r'[\$,]', '', regex=True).astype(float)
Removing Empty Rows
To remove any rows with missing values, we use dropna(); this function scans the DataFrame and removes any rows where data is missing, thus ensuring the completeness and reliability of our analysis.
df.dropna(inplace=True)
After cleaning, we save the refined dataset to a new CSV file, cleaned_products_info.csv. This file now contains streamlined and processed data, ready for analysis.
df.to_csv('cleaned_products_info.csv', index=False)
print("Data cleaning complete, cleaned file saved.")
This is how our new CSV looks now, much more precise and ready to be analyzed:
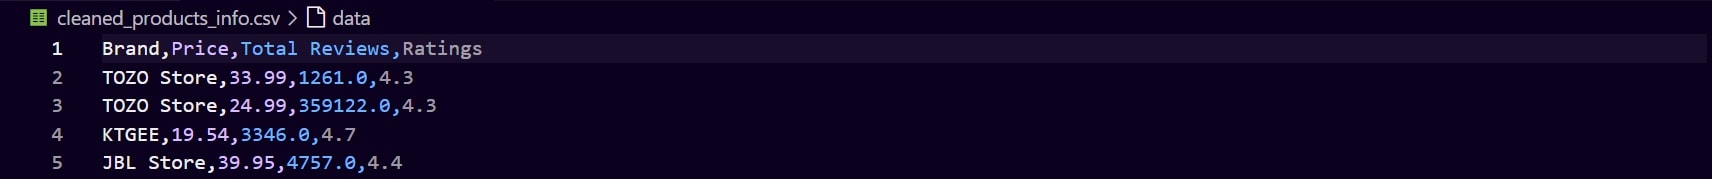
Now, we’re ready to make sense of the extracted data and use it to make data-driven decisions for our product launch!
Amazon Competitive Analysis: Drawing Strategic Insights with Excel
With our data now clean and structured, we move to Excel to get actionable insights from the numbers.
In our scenario, we’ve collected data on several high-performing brands on Amazon, the products in the featured section. We’re looking for the sweet spot for our wireless earphones—a price that resonates with quality-seeking customers while remaining competitive.
Visualizing Price Strategies with Pivot Tables and Charts
Let’s begin by visualizing the price strategies of these top-tier brands. Pivot Tables in Excel are excellent at summarizing and making sense of large datasets. Here’s how we leveraged them:
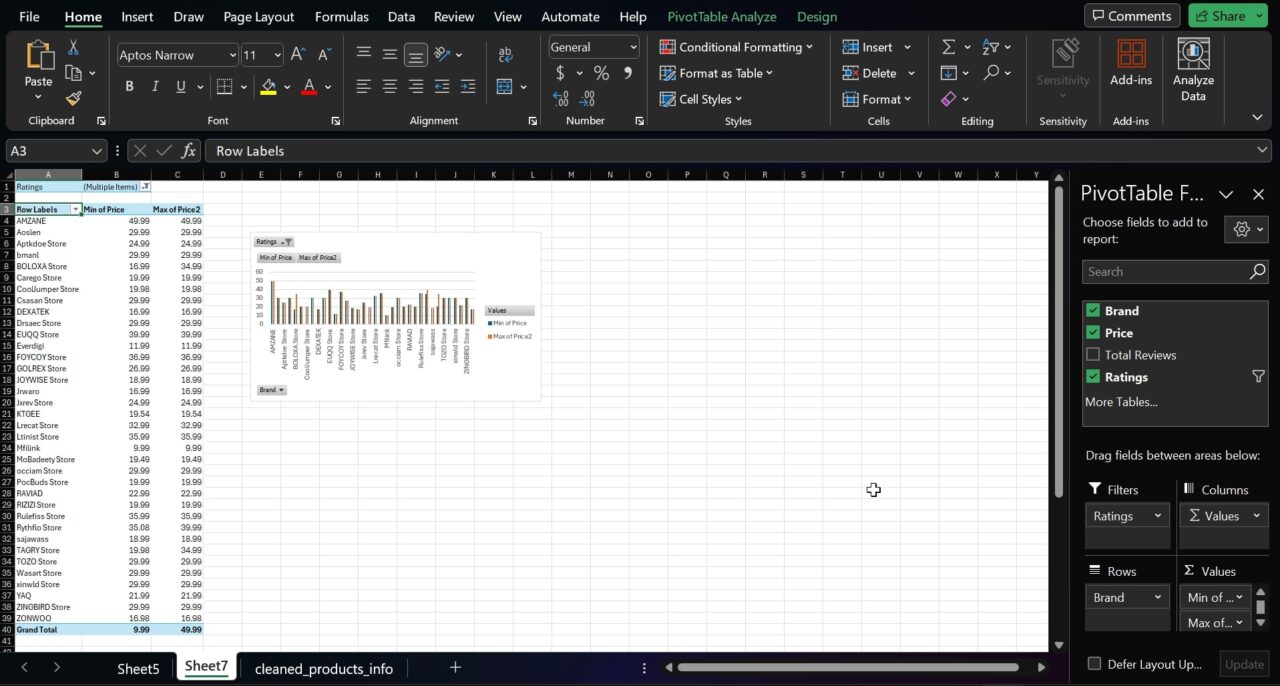
Inserting a Pivot Table and Chart for Price Range Analysis
- Opening the Dataset in Excel: We’ll start by opening our cleaned_products_info.csv file in Excel. This is where we will create our analysis tools.
- Creating the Pivot Table and Chart: Click on the ‘Insert’ tab at the top. From here, select ‘PivotTable & Chart’ – a Pivot Table allows us to organize and summarize selected columns and rows of data, and the chart creates a visual representation of our Pivot Table data. It helps in understanding the data at a glance.
- Setting Up the Pivot Table and Chart: In the Pivot Table field list, drag the ‘Brand’ field to the Rows area. This will list each brand separately. Then, drag the ‘Price’ field to the
Valuesarea twice. Set one instance to calculate the minimum price(min) and the other for the maximum price(max). This setup allows us to compare the price range of each brand.
Filtering for Top-Performing Brands
- Focusing on High Ratings: To narrow down the data to the most successful brands, apply a filter for high average ratings. This means we’ll only look at brands with an average rating of 4.5 or higher.
- Applying the Filter: Click on the filter icon in the Pivot Table’s ‘Ratings’ column. Choose to show only the values that are 4.5 or higher. This filtering highlights brands that have already achieved significant customer ratings and provides insights into the pricing strategies of these top-performing brands.
Adjusting the Chart for Enhanced Insight
- Refining the Axis Scale: Initially, the auto-generated scale of the chart’s axis might be too broad, making it difficult to see detailed differences in the data. To make the chart more informative, adjust the axis scale.
- Fine-tuning the Axis: Right-click on the axis with the numbers in the chart, select ‘Format Axis’ In the Axis Options, and set a minimum bound that narrows the scale. Adjust this value until the chart displays a range that clearly represents the differences in pricing among the top brands.
Interpreting the Chart
This is how our chart and table should look in Excel:
Here’s a closer look at the chart:
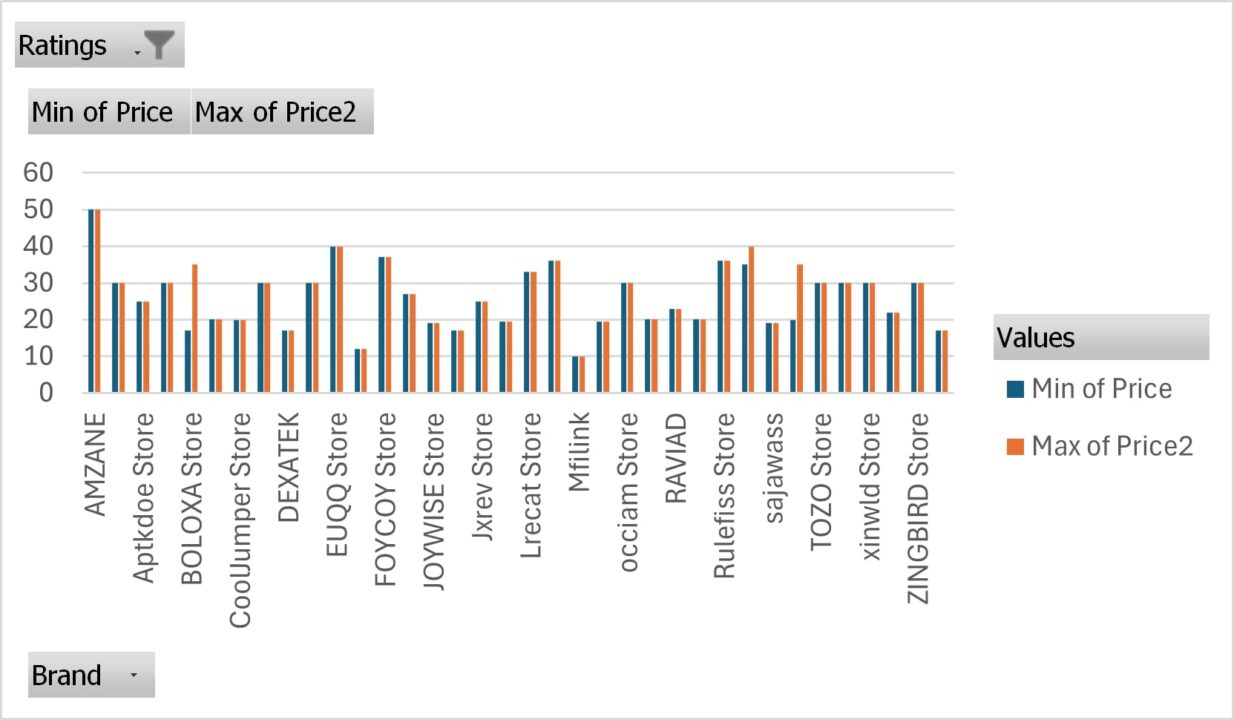
The chart visually represents the minimum and maximum prices for each high-rated brand. This view serves as a strategic map, showing the price ranges consumers find quality acceptable and indicating market positioning.
By analyzing this chart, we can identify where there might be gaps in the market, where competition is most intense, and what price points are associated with high-rated brands. This information is essential in deciding where our new product could fit within the existing market landscape.
Competitive Analysis Example
The chart above can guide our brand, revealing where X marks the spot in the market landscape. It indicates that the grand minimum price was $16.98 and the maximum was $99.98. Here’s how these insights can guide our product launch strategy:
- Spotting the Entry Point: The data shows that even the most respected brands offer products starting at $16. This suggests a market expectation for affordability, even when seeking quality.
- Aspiring for the Premium: The $99 ceiling for top-rated products indicates a reluctance to venture into higher-price territories. Our wireless earphones could push this boundary slightly if additional features justify the increase.
- Balancing Act: Noting the narrow price bands of some brands, we see a disciplined approach to targeting specific market segments. Our earphones must find this balance by offering a range that signifies variety but maintains a clear brand message.
- Strategic Positioning: We must decide whether to challenge the established players at their own game or carve out a new niche. This could mean introducing features that disrupt the status quo or adopting aggressive pricing strategies to capture market share swiftly.
Conclusion
As we wrap up our analysis, it’s clear that competitive analysis is more than extracting raw data. It’s the art of reading between the lines, understanding the narrative, and predicting the next chapter.
Using ScraperAPI and Excel, we’ve painted a comprehensive picture of the Amazon marketplace for wireless earphones.
Now, equipped with these insights, our brand is ready to tune into the market’s frequency, launching a product that meets the consumer’s expectations and plays the right notes to stand out in a competitive symphony.
As we conclude this article, remember that data is the compass that points your business in the right direction. Use it wisely, and your brand can not only navigate the competitive Amazon market but also find its place in the hearts and carts of customers worldwide.
Till next time, happy scraping and competitor scoping!